

Step 1: Create the traces table
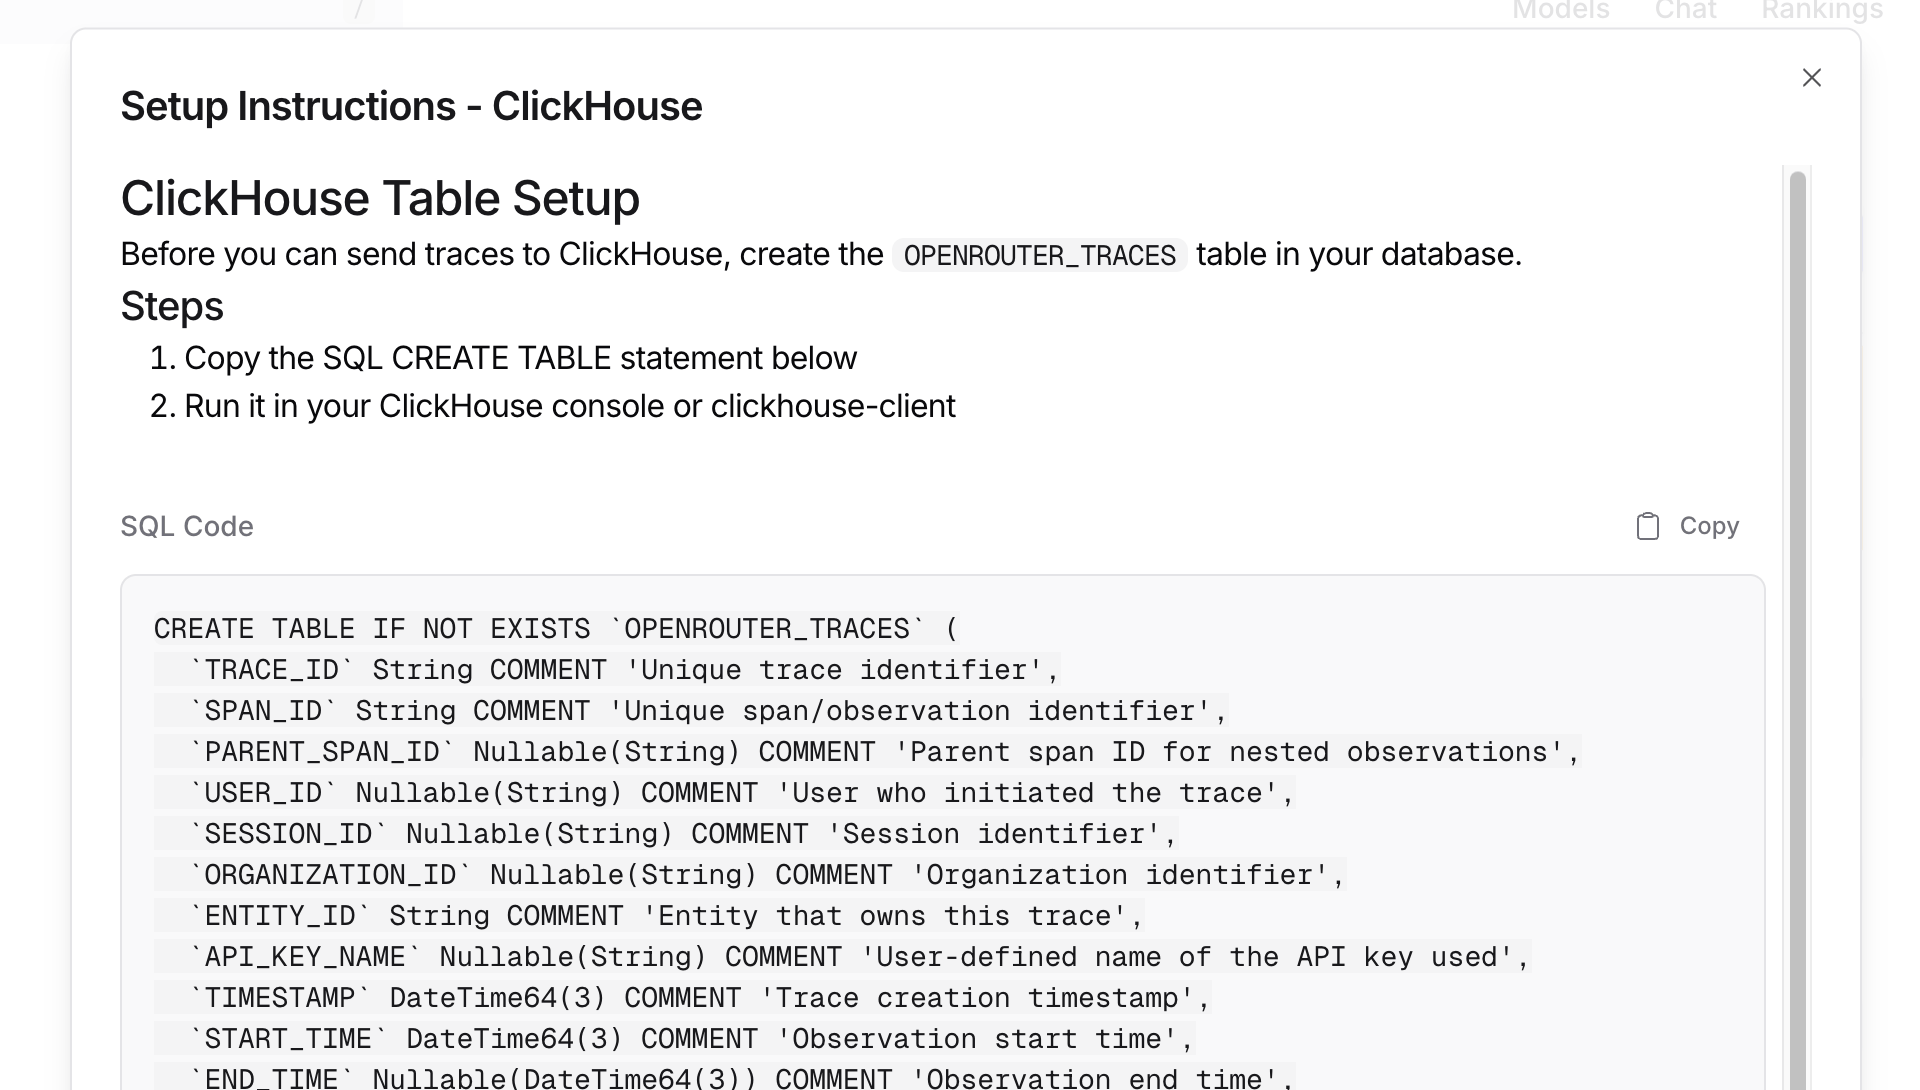
Before connecting OpenRouter, create theOPENROUTER_TRACES table in your ClickHouse database. You can find the exact SQL in the OpenRouter dashboard when configuring the destination:
Step 2: Set up permissions
Ensure your ClickHouse user has CREATE TABLE permissions:Step 3: Enable Broadcast in OpenRouter
Go to Settings > Observability and toggle Enable Broadcast.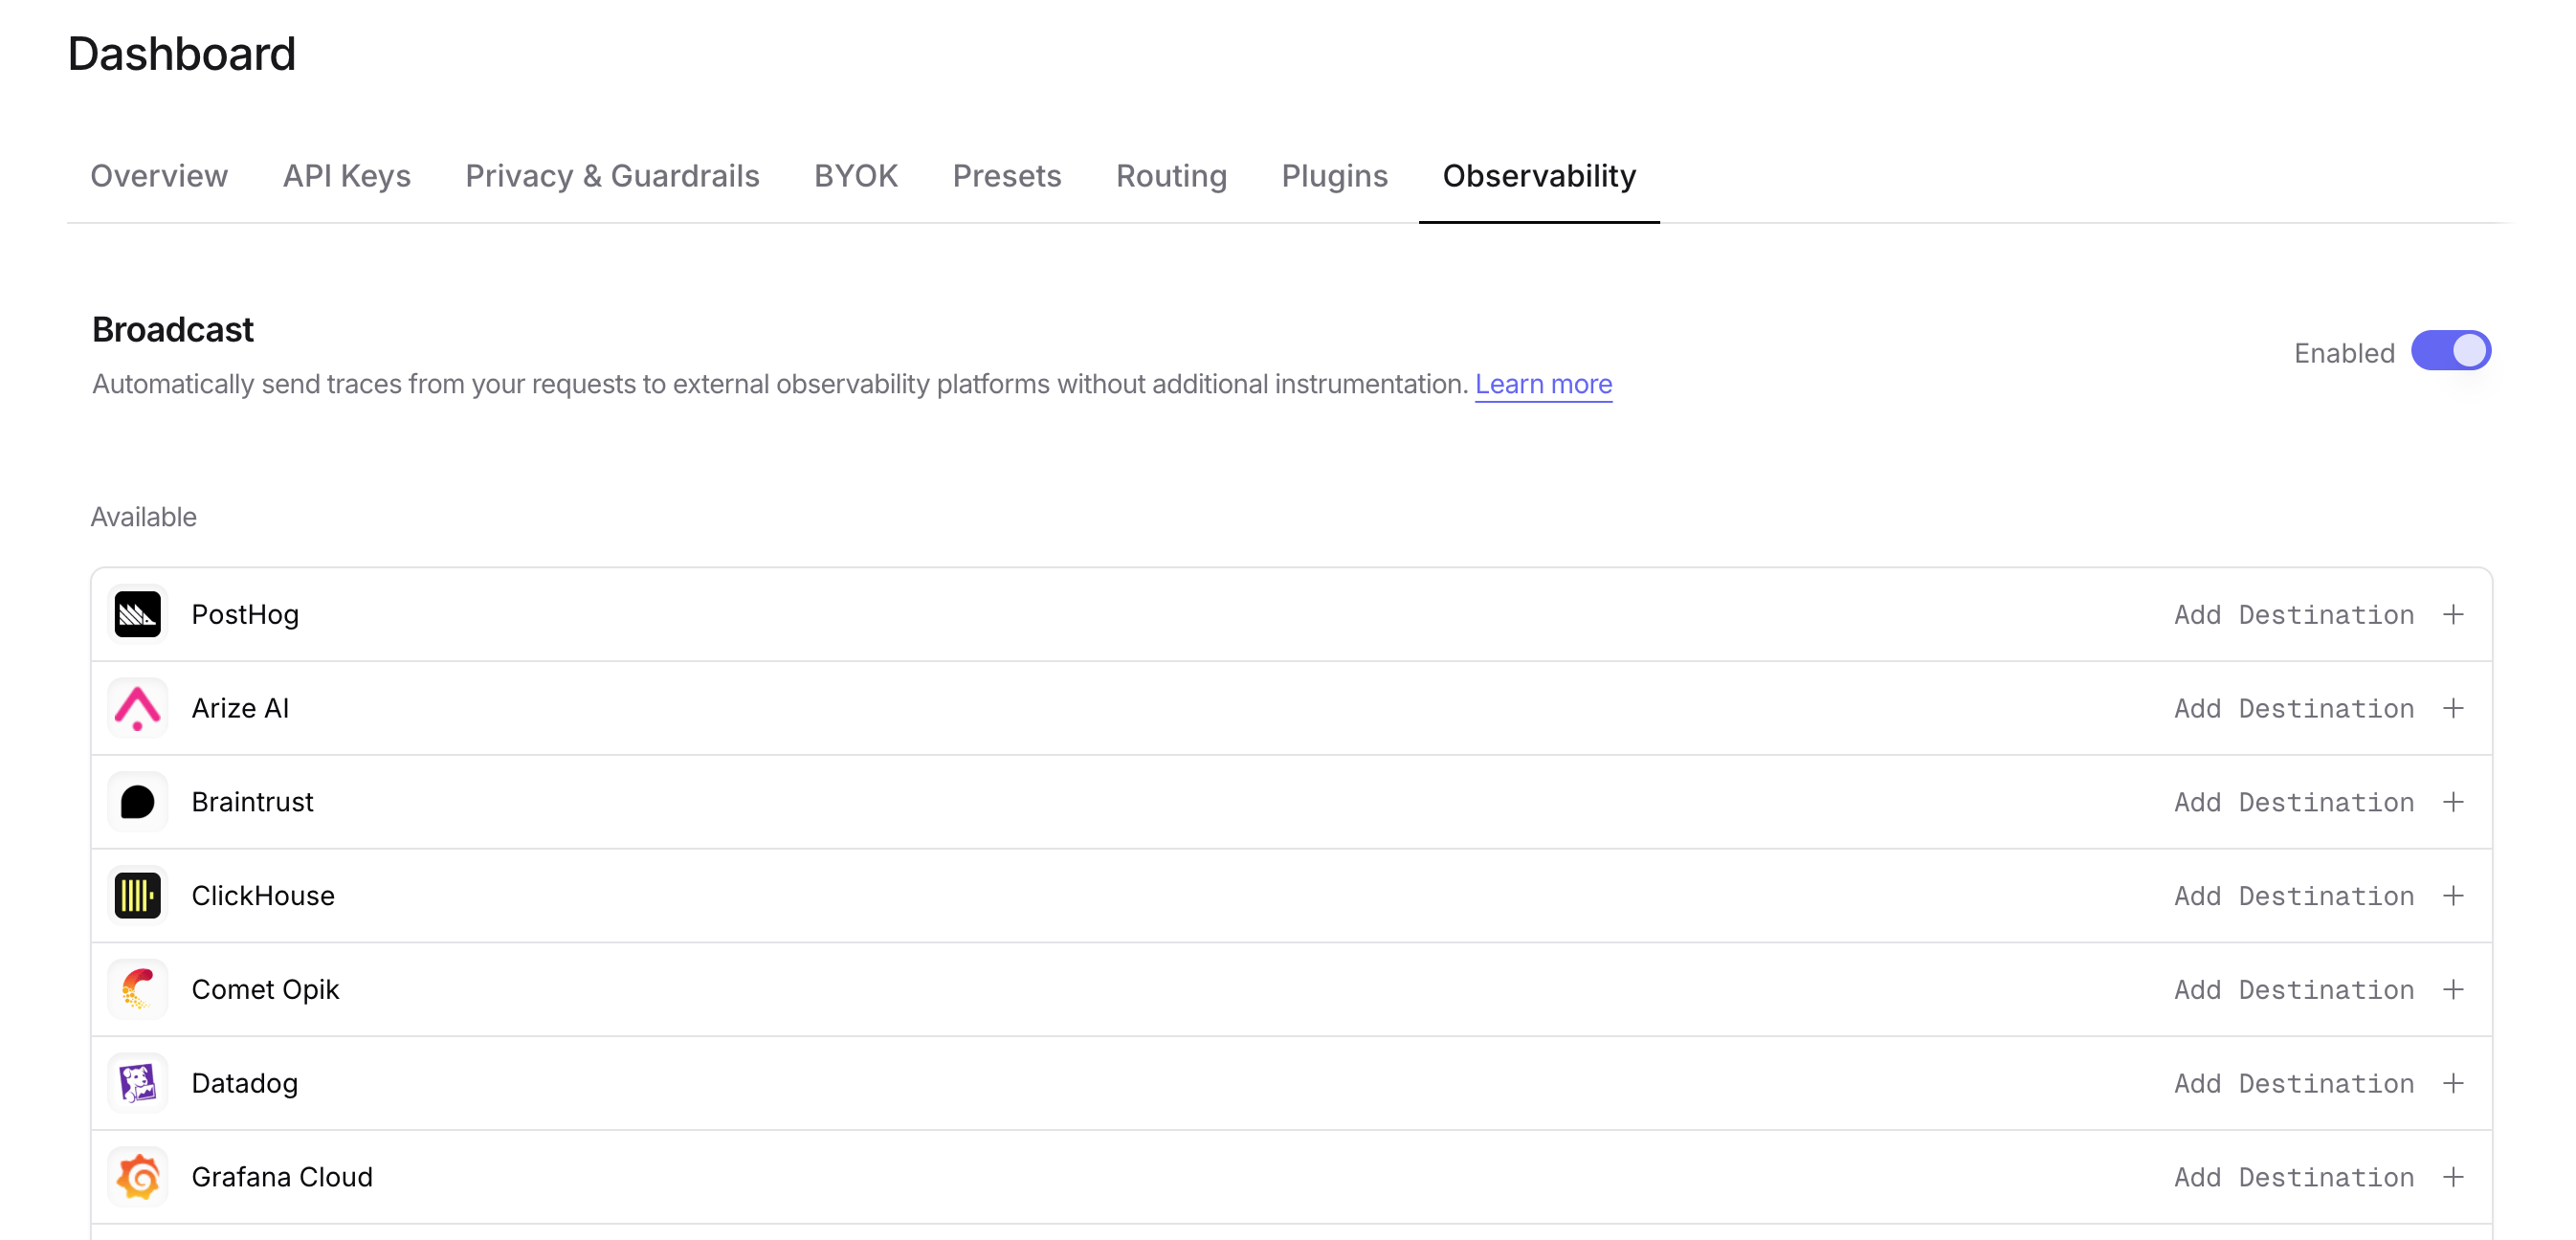
Step 4: Configure ClickHouse
Click the edit icon next to ClickHouse and enter: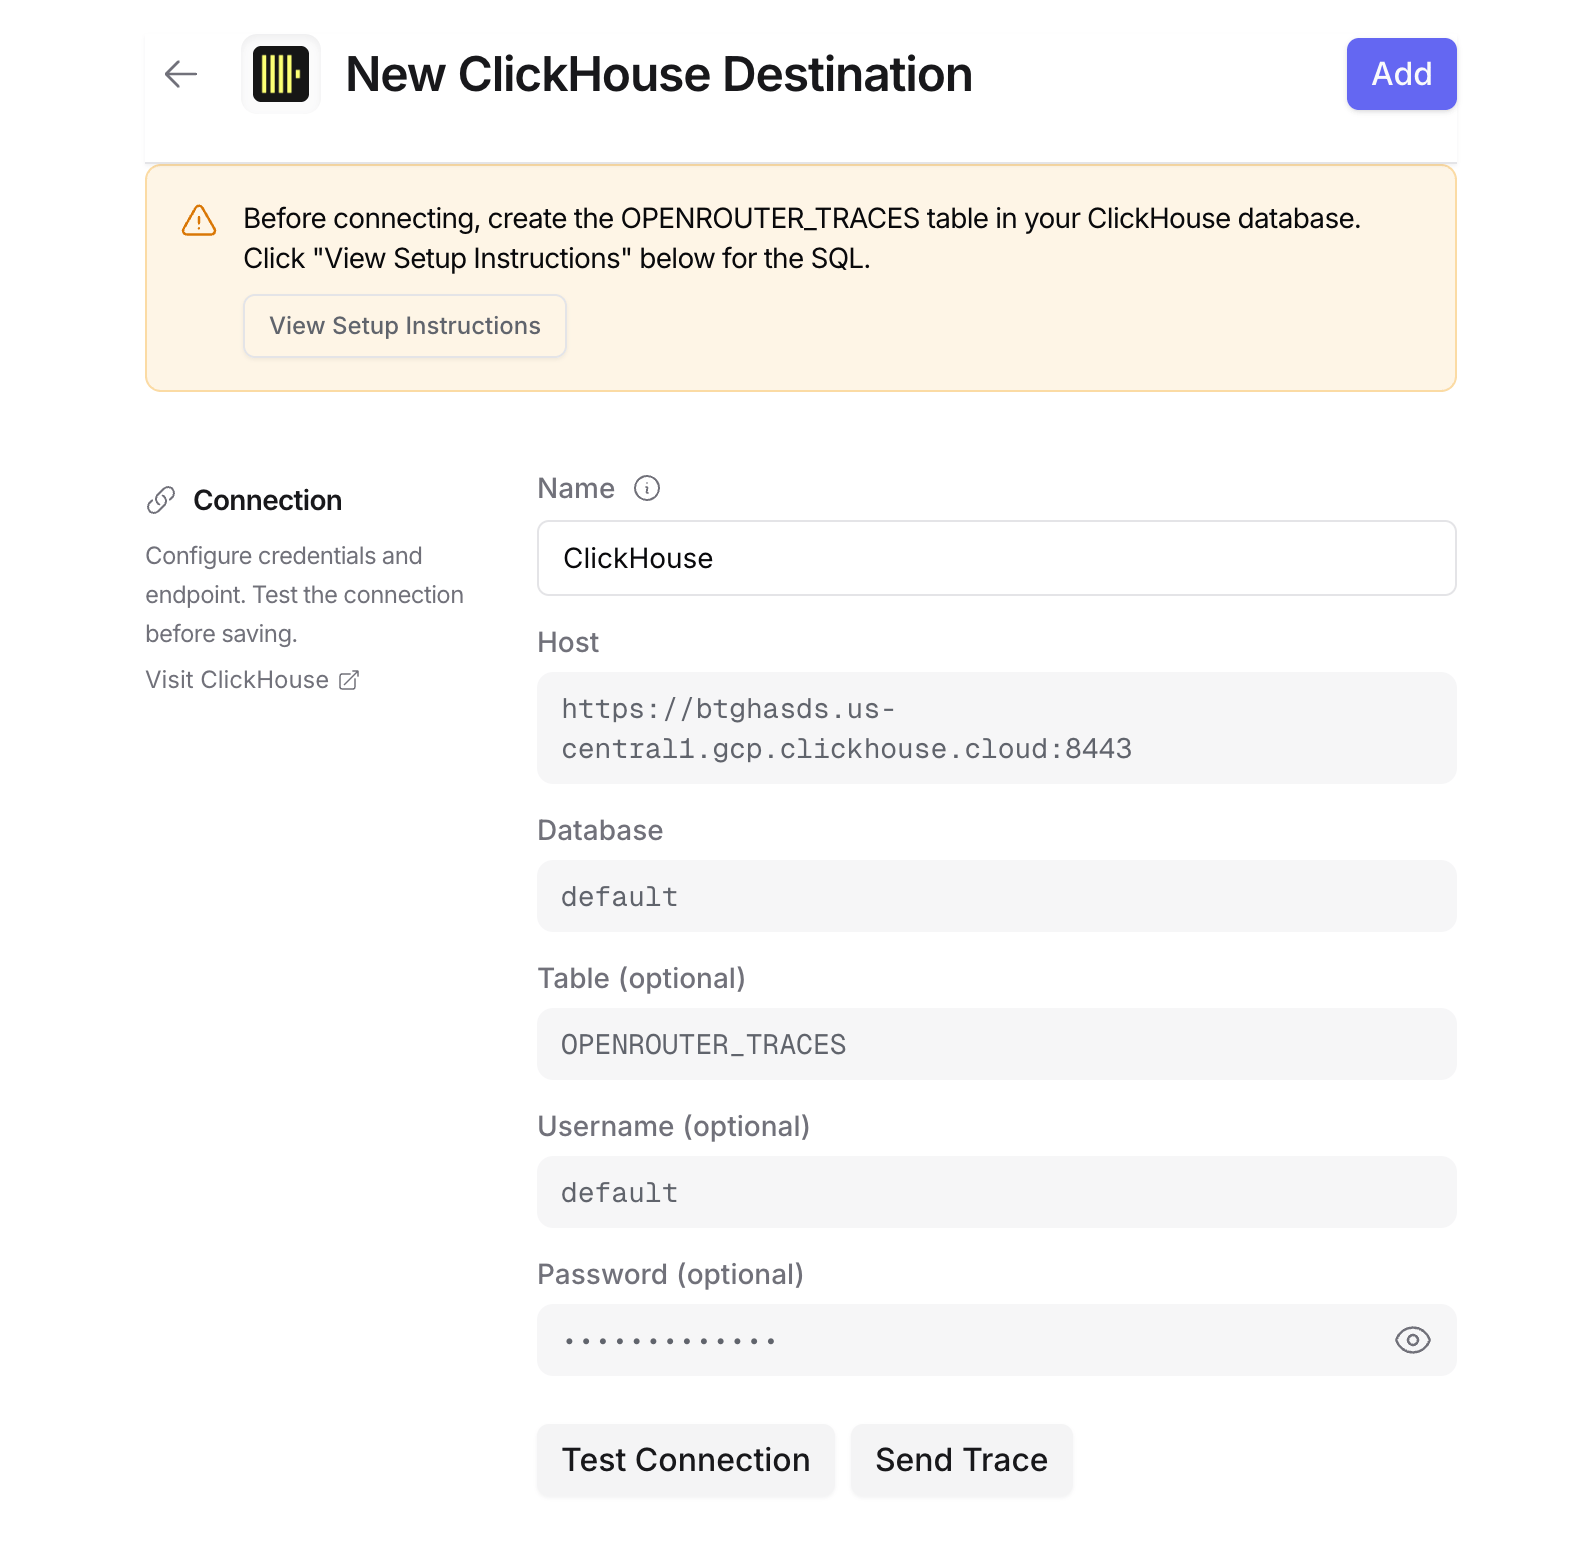
- Host: Your ClickHouse HTTP endpoint (e.g.,
https://clickhouse.example.com:8123) - Database: Target database name (default:
default) - Table: Table name (default:
OPENROUTER_TRACES) - Username: ClickHouse username for authentication (defaults to
default) - Password: ClickHouse password for authentication
Step 5: Test and save
Click Test Connection to verify the setup. The configuration only saves if the test passes.Step 6: Send a test trace
Make an API request through OpenRouter and query your ClickHouse table to verify the trace was received.Example queries
Cost analysis by model
User activity analysis
Error analysis
Provider performance comparison
Usage by API key
Accessing JSON columns
ClickHouse stores JSON data as strings. UseJSONExtract functions to query
nested fields:
Schema design
Typed columns
The schema extracts commonly-queried fields as typed columns for efficient filtering and aggregation:- Identifiers: TRACE_ID, USER_ID, SESSION_ID, etc.
- Timestamps: DateTime64 for time-series analysis with millisecond precision
- Model Info: For cost and performance analysis
- Metrics: Tokens and costs for billing
String columns for JSON
Less commonly-accessed and variable-structure data is stored as JSON strings:- ATTRIBUTES: Full OTEL attribute set
- INPUT/OUTPUT: Variable message structures
- METADATA: User-defined key-values
- MODEL_PARAMETERS: Model-specific configurations
JSONExtract* functions to query these fields.
Custom Metadata
Custom metadata from thetrace field is stored in the METADATA column as a JSON string. You can query it using ClickHouse’s JSONExtract functions.
Supported Metadata Keys
| Key | ClickHouse Mapping | Description |
|---|---|---|
trace_id | TRACE_ID column / METADATA JSON | Custom trace identifier for grouping |
trace_name | METADATA JSON | Custom name for the trace |
span_name | METADATA JSON | Name for intermediate spans |
generation_name | METADATA JSON | Name for the LLM generation |
Example
Querying Custom Metadata
Use ClickHouse’s JSON functions to query your custom metadata:Additional Context
- The
userfield maps to theUSER_IDtyped column - The
session_idfield maps to theSESSION_IDtyped column - All custom metadata keys from
traceare stored in theMETADATAJSON string column - For high-performance filtering on metadata fields, consider creating materialized columns with
ALTER TABLE ... ADD COLUMN